Enron Stock Chart Over Time
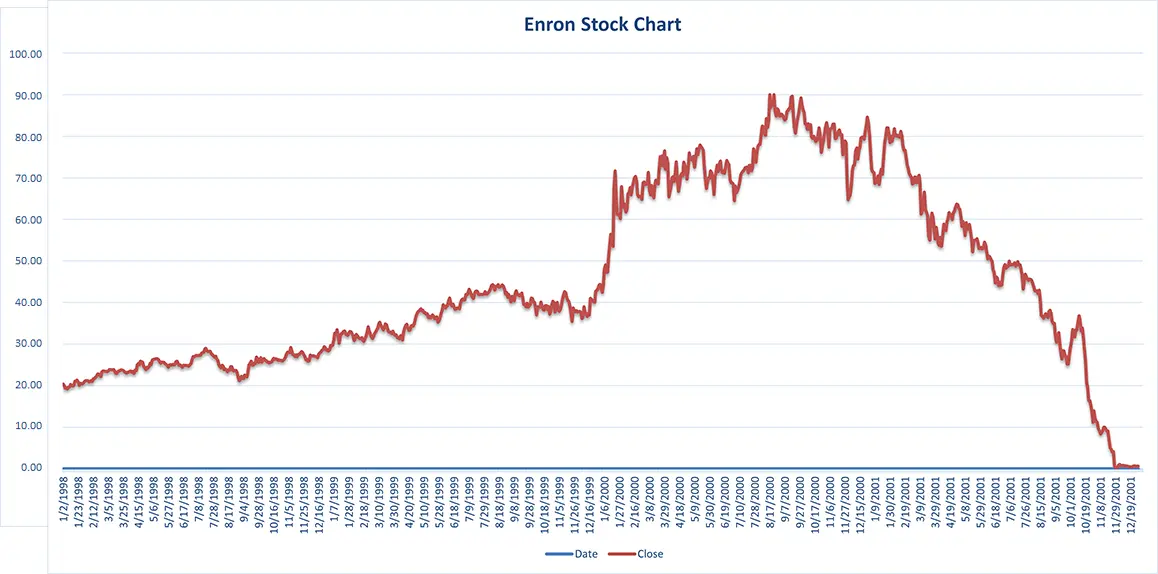
Below is the full history of Enron’s stock chart, from 1998 to the end of 2001.

Enron Daily Stock Price history Excel data
See the full Enron daily stock price history from 1998 to its demise 2001 in Excel and PDF format.
Download EXCEL Enron Stock Chart Data
Download PDF Enron Stock Chart Data
What was the Enron Ticker symbol?
Enron traded under the ticket symbol ENE exchange on the New York Stock Exchange. Later, Enron traded under ENRN when it traded on the NASDAQ.
What is the history of Enron’s stock chart?
Enron was originally called Northern Natural Gas Company, forming in 1930 just a few months after the great stock market crash of 1929. Northern (Enron’s) initial IPO was in 1947 on the NYSE. The Enron we know came to be named after various mergers and acquisitions in 1985, being officially renamed in 1986.
Enron’s initial stock market growth from 1990-1998 was 311% – about in line with the S&P 500’s growth. Then the story gets more interesting:
- From 1999 it increased 56% despite the S&P only increasing 20%
- In 2000, it increased 87% despite a 20% decline in the S&P. It hit it’s highest stock price this year at $90.75 per share.
- In 2001, the share price slowly tumbled. Despite some rallies, in hit a low of $0.25 per share on 30th November 2001.
Key moments in Enron’s stock chart history

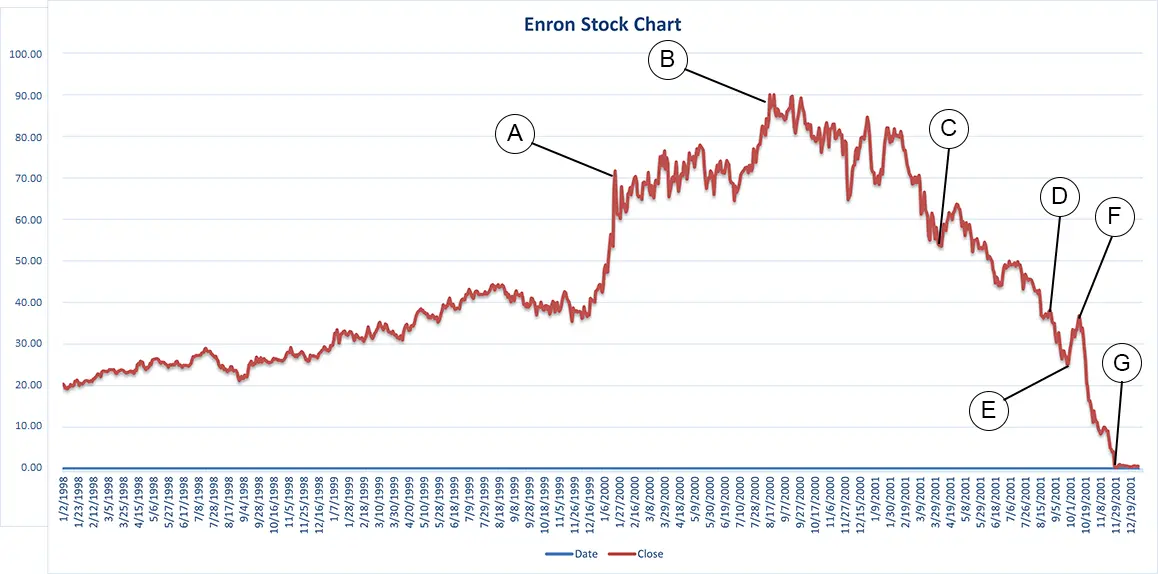
- Extreme growth from December 1999 to January 2000 as Enron defies expectations. Enron is considered one of America’s most innovative companies
- August 23rd 2000: Despite the Dot Com bubble starting to burst, Enron powers on. The stock price hits a high of $90.75.
- April 17th 2001: The stock price receives a boost as Enron reports Q1 profits of $536 million.
- August 14th 2001: Jeffrey Skilling resigns, citing personal reasons. Kenneth Lay takes over as CEO and just a week later, sells 93k shares.
- September 26th 2001: The stock price receives another boost as Kenneth Lay reassures employees that Enron stock is a good buy. This, despite the fallout from 9/11.
- October 16th 2001: Enron reports a Q3 loss of $618. This, combined with an SEC investigation into Enron’s accounting practices just 6 days later starts a mass sell-off.
- 2nd December 2001: Enron files for bankruptcy.
Enron’s internal email sentiment analysis visualized (video)
The below video maps Enron employee’s real feelings towards the meteoric rise and fall of Enron’s stock. Watch as the share price rises and good PR continues to solidify the company’s position as a safe and high growth business. Then, as question marks start to arise, see the sentiment of employees turn to anger, fear and disgust as the share price collapses. Credit to /u/Ok-Craft-9908.
Enron’s internal emails from 150 senior managers
You can search Enron’s internal email dataset here. It was used to create the above visualization.
It contains data from about 150 users, mostly senior management of Enron. In total, it is about 500,000 email messages. As part of the investigation into Enron’s collapse, this data was made available to the public.
What was Enron’s highest stock price?
Enron’s highest stock price shortly before its collapse was $90.75 on August 23rd 2000.
What was Enron’s lowest stock price?
Enron hit an intra-day low of $0.25 per share on November 30th 2001. This was shortly before their bankruptcy filing on December 2nd 2001 on complete collapse of the company.
How much is Enron’s stock worth today?
Enron stock is not worth anything today. However, Siemens Energy AG trades under ENRN, hence you will still find the stock under Enron’s original ticker.
What was the Enron Logo?
The Enron logo is below. The logo was designed by American art direction Paul Rand before his death in 1996.

Enron stock price history – why did Enron fail?
Enron aimed to revolutionize the energy industry but ultimately faced a catastrophic collapse. Led by Skilling and Lay, the company expanded into energy trading and services, but its success masked deceptive accounting practices.
Enron’s rise was marked by innovation and rapid growth, trading commodities and creating the Enron Online platform. However, behind the scenes, the company used complex accounting techniques to manipulate its financial statements and deceive investors.
The company’s stock price soared to a record high of $90.75 per share in August 2000, but the truth began to unravel in 2001. Revealed fraudulent practices and financial mismanagement led to a significant loss announcement and restatement of financial statements, exposing hidden debt.
As the revelations emerged, investor confidence evaporated, leading to a dramatic decline in Enron’s stock price. By November 2001, Enron filed for bankruptcy protection, becoming one of the largest corporate bankruptcies in U.S. history.

The collapse of Enron shook financial markets and eroded public trust, highlighting the need for regulatory oversight and accounting reforms.
Enron’s executives, including Skilling and Lay, faced criminal charges for fraud and insider trading. The case served as a stark reminder of the consequences of corporate greed and deception.
The Enron saga emphasizes the importance of transparency, ethical practices, and robust checks and balances in the corporate world.
Why the history of Enron’s stock chart matters
Actively picking stocks is still the most popular form of trading today. You can pick a great company on paper and be severely punished.
Back in the day, ‘diversification’ meant picking about 15-20 US stocks. That was considered a diversified portfolio.
Today, diversification is closer to 7,000 global stocks, that tracks an index. This is passive investing through index funds, and it helps to mitigate the risk.
When your portfolio is just 20 stocks, the risk is large. Any investment where there is a possibility you can be ‘wiped out’ – no matter how small the risk – is not worth investing in.
Wouldn’t you be invested in Enron through passive investing?
Yes, but your exposure would be orders of magnitude lower. If one of your 7,000 stocks goes bust, it is but a blip on your portfolio chart.
Learn more about passive investing with our passive investing guide.


