Active investing vs Passive Investing Statistics
It’s stock picking vs. index fund investing – what do the stats say?
Here are 6 almost unbelievable stats and trends that might make you think twice about active and passive investing options.
1. Passive index funds and ETF’s have grown from 21% share of the assets managed by investment companies in 2012 to 45% in 2022.
Passive funds are now nearly as popular among investment companies as their actively managed counterparts (Statista 2023). As well as the growth in passive funds, active funds have accordingly shrunk from 78% to 54%.

This may be because the passive funds are cheaper and (historically) have provided a better investment return. It’s difficult to look past those two salient facts when choosing an investment strategy.
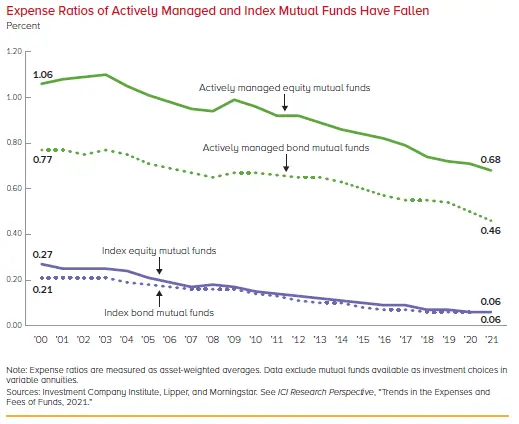
2. The cost (expense ratio) of the average passively managed fund is now at an all-time low.
According to the ICI (2022) the average actively managed fund cost 0.68% in 2021 vs. just 0.06% for passively-managed index funds.

The difference may seem small, but small fractions of a percentage can add up to hundreds of thousands of dollars in fees over your investing lifetime.
The affordability of passive investing has brought in many new investors – both beginners and seasoned investors.
>> Read more: The cost of passive investing – how much should you pay?
3. 90% of international active investment funds cannot outperform an index fund over a 20-year period
According to S&P Indices Versus Active (SPIVA) report, on any given year, an international active fund has a roughly 50% chance of underperforming the S&P. This grows to 90% over a 20-year period:
| Time period | Percentage chance of beating S&P |
|---|---|
| 1 year | 50% |
| 3 years | 40% |
| 5 years | 30% |
| 20 years | 10% |
This is an alarming statistic, as you pay a premium for actively managed funds to get a professional investment fund manager to make decisions about the portfolio. Yet 9 out of 10 of the professionals fail to beat the average over time when you take the fees into account too.
Except for the lucky 10%, you won’t get what you pay for when paying the premium for an actively managed fund.
4. 92% of U.S. large-cap active funds underperformed the benchmark over the last decade.
Morningstar’s Active vs. Passive Investing Report (2022) looks at the net performance of active and passive funds (i.e., after fees).
The barometer found that only 23% of active funds were able to exceed the returns of their average passive rivals over a 10-year period.
They also found that a staggering 92% of U.S. large-cap funds underperformed the benchmark over the last decade.
>> Read more: Active vs. Passive Investment Performance
5. Investing just over $400 a month into the S&P 500 would make you a millionaire in 30 years.
Given historical average returns of 10.25% (which there is absolutely no guarantee of in the future), you could be a millionaire by investing $5,000 a year into the S&P 500 for just three short decades.

If you can afford to invest just $4 a day from your early 20’s to the time you retire, you would also retire as a millionaire.
Want to invest less or more? Want to see what different investment returns would yield? Have a play around on our Index Fund investment return calculator.
6. More than a third of financial academics cannot rule out a passive investment bubble driven by the rise of index funds.
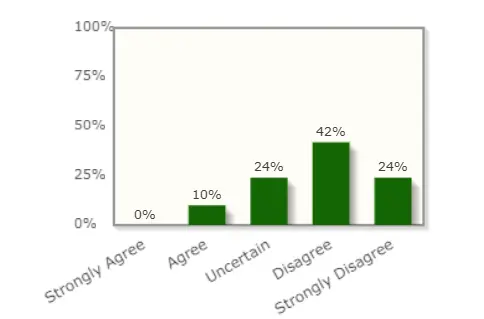
A poll by The Initiative on Global Markets in November 2022 put the question of falling market efficiency to 40 academics.
10% of academics agree that the current level of investment in index funds and other passive vehicles is distorting market efficiency. This distorts the pricing of stock and can cause a bubble.
Almost a quarter of academics couldn’t be sure.

For all the above reasons (low cost, great performance, completely hands off), passive investing has become extremely popular. Many people are questioning whether it is causing a passive investing bubble as a result.


